Measurement Insights
Tequra Analytics has powerful features which get more information from your measurements
Process Capability
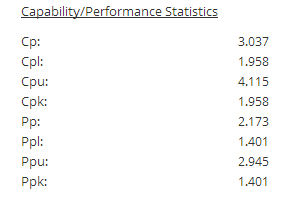
Tequra Analytics enables you to get a quantitative insight into the variability of a manufacturing process. Using the process capability features you retrieve process capability index and process performance index figures at the touch of a button.
More on Process Capability
| Name | Description |
|---|---|
| Cpk | Process Capabilty |
| Ppk | Process Performance Index |
| Cp | Process capability. Unlike Cpk it ignores whether measurements are not well centered between limits. |
| Cpl | Process capability for measurements with only a lower limit. |
| Cpu | Process capability for measurements with only an upper limit. |
| Pp | Process performance index. Unlike Cpk it ignores whether measurements are not well centered between limits. |
| Ppl | Process performance index for measurements with only an upper limit. |
| Ppu | Process performance index for measurements with only a lower limit. |


Statistics
Easily perform statistical analysis on your test results using Tequra analytics. Pull out figures such as mean, median standard deviation and max-min. Use filtering to select a region of interest to perform the analysis over.
Full Statistics Listing
| Name |
|---|
| Mean |
| Median |
| Min |
| Max |
| Standard Deviation (Short Term) |
| Standard Deviation (Long Term) |
Measurement Histogram
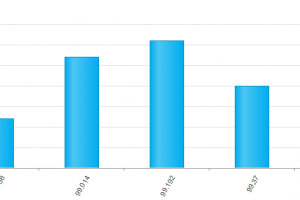
See a graphical representation of measurement distribution using the Tequra Analytics histogram feature. Use filtering tools to select a section of results to perform this analysis over.


Measurement Trend
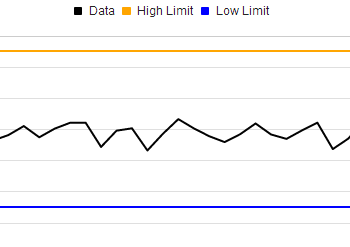
Look for trends in individual measurements over time, with this graphical view. Use filtering to restrict the data to a particular time range. See how measurements lie compared to upper and lower test limits.
Graphical Waveform Comparison
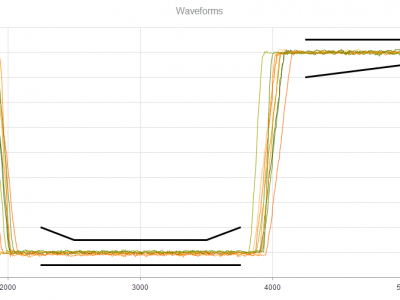
Perform a visual comparison between waveform measurements using this powerful Tequra Analytics feature. Variations between measurements are brought to life with this view, enabling users to get a greater understanding of what is happening.
With Tequra Analytics waveform measurements can be easily imported in and limits applied in the form of arbitrary shapes. A selected range of waveforms can be overlaid together, using different colors, to form this report view.

