
We’ve listened to comments from users and reviewed our features. Now we’re pleased to present a range of enhancements to the Tequra Analytics product.
Yield Dashboard
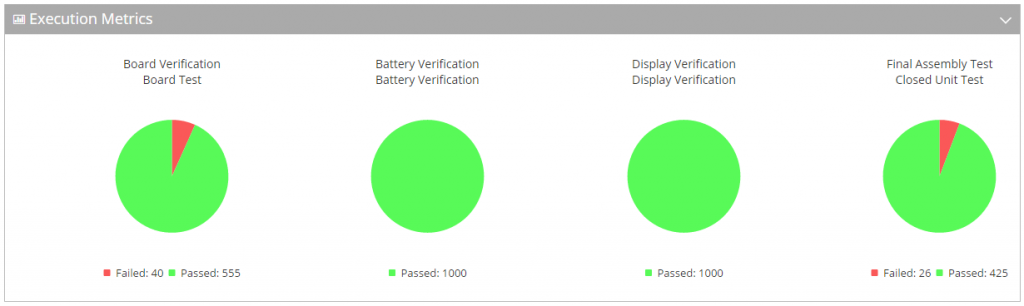
Get an even clearer overview of product testing with the new pie-chart view. As before the dashboard shows manufacturing success at-a-glance, with details displayed by hovering over parts of each pie-chart.
Measurement Trend
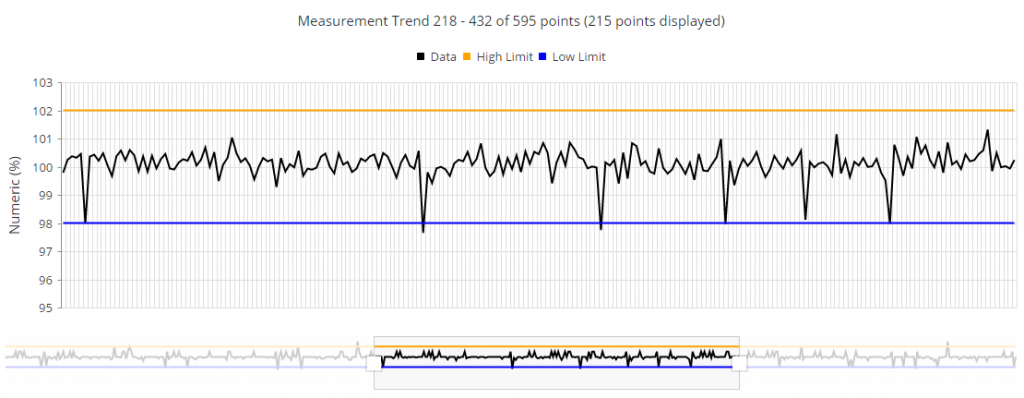
Navigate aggregated measurement trends with even more ease. Enhanced overview display, gird-lines, zooming and drill down into results are now provided.
Results Histogram
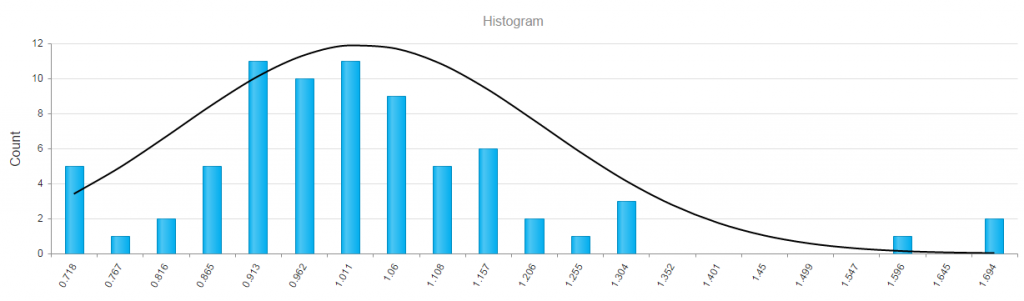
The histogram of aggregated measurement values is now even clearer, with our smooth fit line.
DPMO: Defects Per Million Opportunities
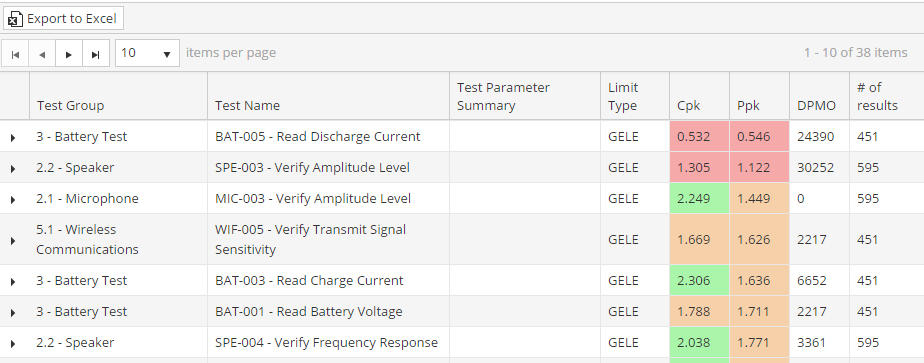
Now get DPMO calculations alone side Cpk and Ppk.
Waveform Display
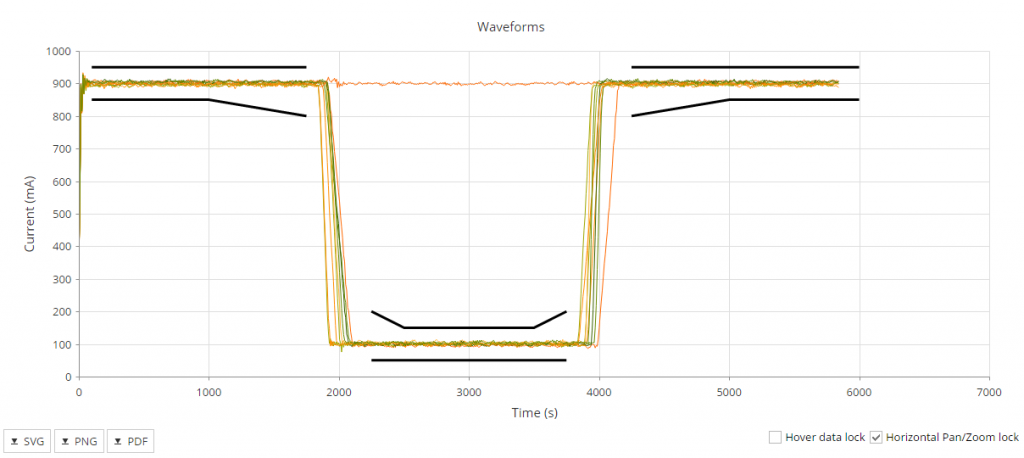
A few Pan and Zoom tweaks make our waveform display easier to use.
Data Export

Most data can be exported to Microsoft Excel in a single click now. Just look for the ‘Export to Excel’ button.
Failure Pareto
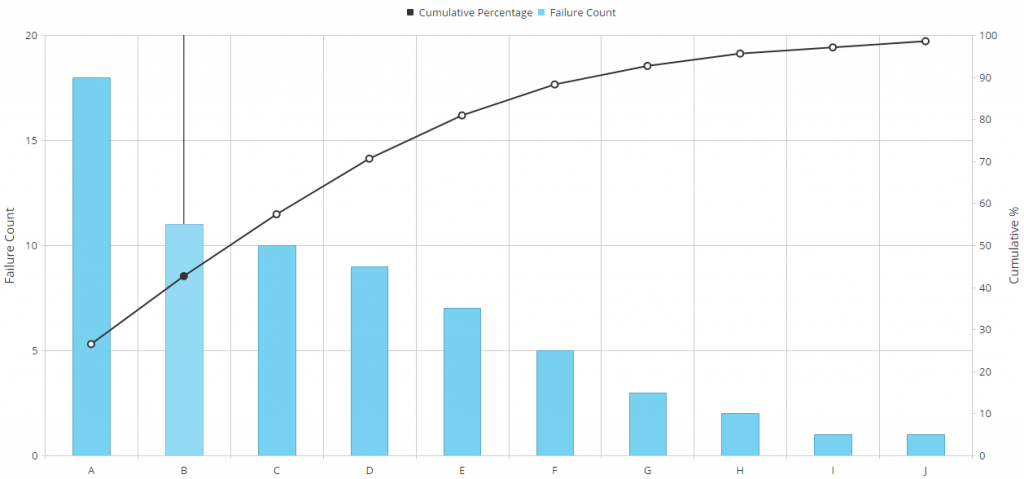
With better filter options and a clearer to read graph display, Pareto analysis is even more powerful.
Future Improvements
Not found the feature enhancement you require? Why not Contact Us with what you’re looking for?