Process Insights
Extract valuable process information with Tequra Analytics
Yield Figures
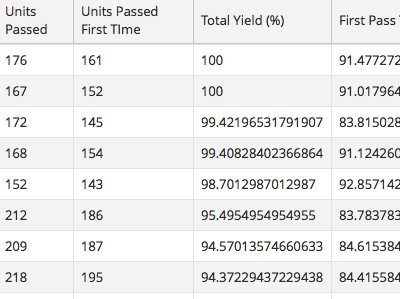
With Tequra Analytics you can get a real-time report on your first-pass and total yields at the touch of a button. With easy to configure filtering you can focus on the time period, process, unit variant or test station that interests you. Side-by-side views enable you to easily compare yields and identify areas for improvement.
More on Yields
| Name | Description |
|---|---|
| First Pass Yield | Percentage of units that fully pass testing on the first attempt |
| Total Yield | Percentage of units that have eventually passed testing, |
| Yield by Manufacturing Stage | First Pass and Total Yields split by manufacturing stage |
| Yield by Operation | First Pass and Total Yields split by operation type |
| Yield by Operator | First Pass and Total Yields split by operator |
| Yield by Software Version | First Pass and Total Yields split by test software version |
| Yield by Unit/Product Type | First Pass and Total Yields split by unit or product type |


Pareto Analysis
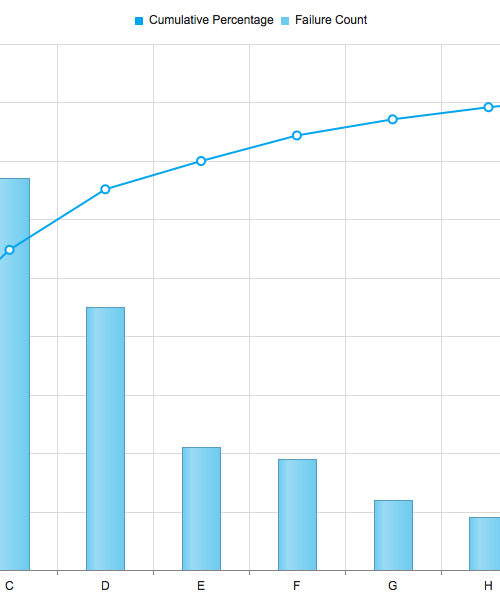
What are the most common test failures that occur for your process? Which issues have the largest impact and which ones are minor? Are we focusing our resources on the most common problems first?
Pareto analysis is a tool that enables you to answer these questions. By aggregating across a selection of test results a histogram can be built-up showing the most common issues, ranked by the percentage of failures. Filtering tools let you narrow down the analysis, enabling you to see for example, how process changes have altered the levels of particular issues found.
Execution Status
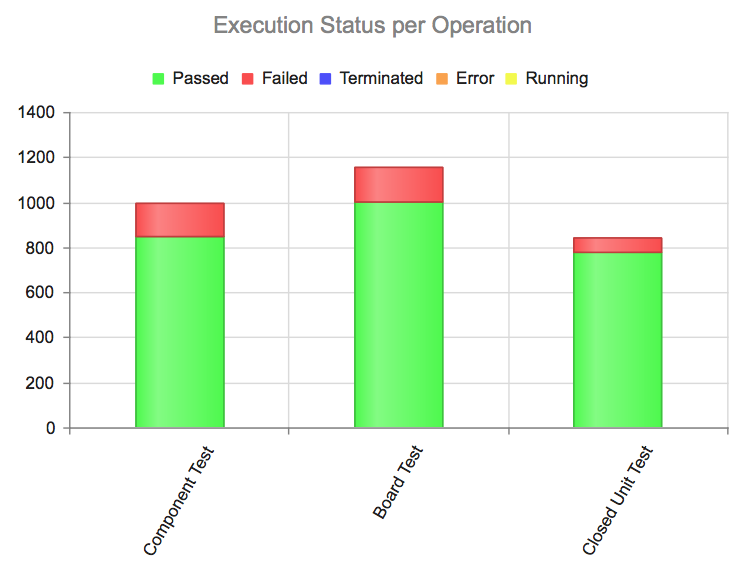
With execution status in Tequra Analytics, you can see a real-time overview of activities across all your test facilities. The graphical view gives a clear indication of overall passes and failures, split by operation. From the top-level view, filtering and drill-downs enable you to access more detailed information.

